7
Asia Symone Palmer; Ruth V. Walker; Kristen J. Black; Chloe Oberkirch; and Matt C Cavanaugh
Download Data Sets:
Researchers Li, Wu, and Xiong (2021) published a study in the open-access journal, PLoS ONE, to understand the relationship between employee levels of cultural intelligence and their innovative behaviors in the workplace. Past researchers have found that an employee’s ability to adapt to cross-cultural environments is associated with better job performance in culturally diverse settings (Ang et al., 2006). There has been a lack of research into the relationship between cultural intelligence and sustainable innovation behavior; however, past research in this area has found a relationship between cultural intelligence and employee adaptive work behavior (Pandey & Charoensukmongkol, 2019), employee creativity (Hu et al., 2017), and an organizations’ ability to create and adopt innovations (Gölgeci et al., 2017). Li and colleagues (2021) focused on studying the relationship between employee cultural intelligence and sustainable innovation behavior, defined as “The act of generating new ideas and translating those ideas into practice” (p. 4).
The researchers measured Sustainable Innovation Behavior (SIB) by asking participants to answer six questions rated on a 7-point likert scale. Higher scores on this scale indicate higher levels of innovative behavior. A sample item includes, “I often come up with creative ideas.”
The researchers measured Cultural Intelligence (CQ) by asking participants to answer 12 questions rated on a 7-point likert scale. Higher scores on this scale indicate higher levels of Cultural Intelligence. A sample item includes, “I vary the rate of my speaking when a cross-cultural situation requires it.”
Hypotheses
We will test one of hypotheses Li and colleagues (2021) proposed, namely that there will be a positive relationship between employees’ cultural intelligence and sustainable innovation behavior. This means they hypothesized a positive correlation, but for now, we will just hypothesize that correlation exists and conduct a non-directional (two-tailed) test. Two-tailed tests are the default approach in most applications of data analysis, even when we may suspect one direction over another. It is the most conservative approach and allows us to look for results opposite to our expectations.
The null and alternative hypothesis would be:
- H0: Employee cultural intelligence will be unrelated to sustainable innovation behavior; or r = 0.
- H1: Employee cultural intelligence will be significantly related to sustainable innovation behavior; or r ≠ 0
Assumption Testing
We need to test several assumptions to get started.
Assumption One: Are our variables continuous?
Yes. All our variables – sustainable innovation behavior and cultural intelligence – are numerical values. They use multiple Likert scale items to create a total score on each of those measures. This means these variables are continuous, interval level data. This data is appropriate for analysis with a correlational study. They have also been labeled appropriately in Jamovi, because we see the ruler icon in the corner of each variable name.
Assumption Two: Are our variables normally distributed?
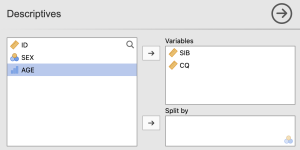
Let’s tackle these next two assumptions with some data visuals and descriptive statistics. We can get these by clicking the Descriptive Statistics menu. Then select the two variables we need for our hypothesis tests (CQ and SIB) and move them over.
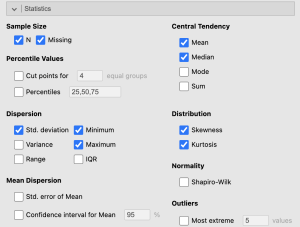
We will also request skewness and kurtosis numerical estimates in our “Statistics” section of the descriptive statistics menu. Under the “Statistics” section, check the boxes for skewness and kurtosis.
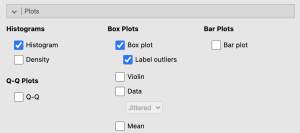
To check for normality and outliers, we will look at our options under “Customizable Plots.” Let’s check the boxes for “Boxplots,” “Label outliers.” Under “Basic Plots,” we will check the box “Distribution plots.”
Looking at our results, the histograms give us a sense of whether our distribution is normal (symmetrical). The histograms for both CQ and SIB look approximately symmetrical, so we’re happy with both of those.
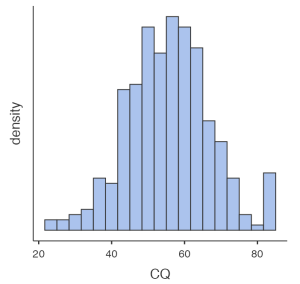
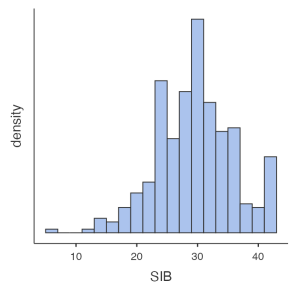
As another check for normally distributed data, in addition to our histogram, we can interpret the skewness and kurtosis statistics. We want skewness and kurtosis statistics that are between -2 and +2. Remember, we have two variables, so we have to check the skewness and kurtosis values for both sustainable innovation behavior and cultural intelligence.
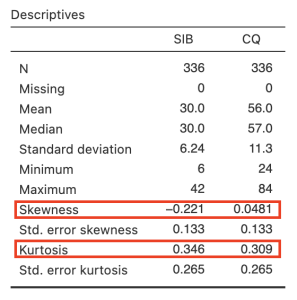
Looking at the values on the output copied above, we can see our skewness values for CQ (0.05) and SIB (-0.22) are both within the acceptable range of -2 and +2. Additionally, the kurtosis values for CQ (0.31) and SIB (0.35) are also within the acceptable range of -2 and +2.
To report these results in APA format, we could write:
- CQ and SIB scores were normally distributed, skewness and kurtosis statistics were between -2 and +2.
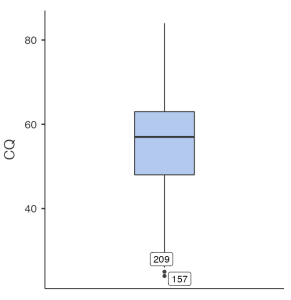
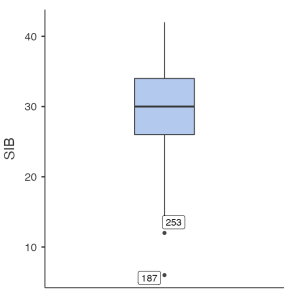
Assumption Three: Are there any outliers?
To check that we meet this assumption, we will look at the boxplots in our results. The boxplots show us that both cultural intelligence (CQ) and substantial innovation behaviors (SIB) have two outliers. However, since our normality statistics look good, we will go ahead and proceed with our analyses.
Assumption Four: Is the relationship between our variables linear?
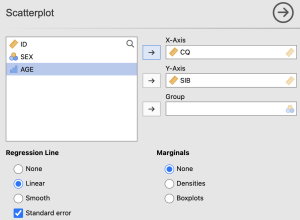
To check this assumption we will need to go back to the exploration tab and select the “Scatterplot” option. Move CQ into the ‘X-axis’ box and SIB into the ‘Y-axis’ box. Under ‘Regression Line’ select the ‘Linear’ option and check the box labeled ‘Standard error’.
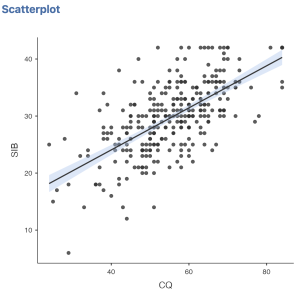
As we look at our scatterplots using the raw variables, it is clear that lots of the data is clustered at the middle of our x axis but are still evenly distributed along the line (because our variables are not skewed), so the pattern of the relationship does appear to follow a rough line. So, we can confirm that the assumption for linearity is ok.
Primary Analyses
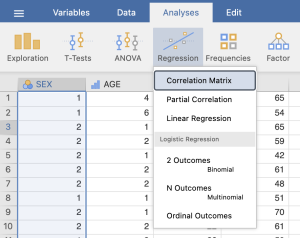
We are going to start with how to run a basic correlation in Jamovi. We will find correlation nested under the regression menu.
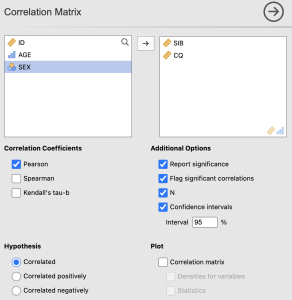
We will first move over our two variables that are in our hypotheses. Taking a look at the extra options, here’s what we will (and can) specify:
- Correlation Coefficients: “Pearson”
- Additional options: we will check the boxes for “Report significance”, “Flag significant correlations”, “N” and “Confidence intervals”.
- Hypothesis: Notice, you can specify a positive or negative correlation in the jamovi menu, but we are doing a two-tailed test, so we will keep the default option of “correlated” for our alternative hypothesis.
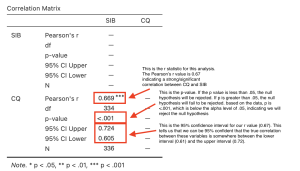
Let’s look at our basic output. Correlation tables are arranged in a matrix. You can locate the correlation between two variables by looking at where the row for that variable intersects with the column for the other variable. At the intersecting point, we see a few pieces of information reported: 1) the sample size used to compute the correlation, 2) the actual Pearson’s r value, 3) the associated p-value for interpreting significance, 4) the confidence interval estimate around that value of r. Confidence intervals provide a range of values that the population correlation is likely to fall between. With the example of the correlation between employee cultural intelligence and sustainable innovation behavior, our estimated correlation is r = .67, but the range of likely values that the true correlation could be are between .61 and .72. The main pieces of information we typically report, are highlighted in the figure below.
As we think about interpreting our results in line with our hypotheses, we would say that our hypothesis was supported because the p-values associated with each correlation are smaller than our alpha value of .05. Employee Cultural Intelligence was related to sustainable innovation behavior. The general format for our APA statements for a correlation are:
r (df) = r statistics, p < .05 or > .05
df = N – 2
Note, sometimes r2 is also included at the end.
Applying this format to our study hypotheses:
- r (336) = .67, p < .05
If we wanted to include confidence intervals, we would report it as
- r (336) = .67, p < .05, 95% CI [0.61, 0.72]
Interpreting the practical significance
We have general guidelines that tell us our correlation of .67 would be considered a relatively strong correlation. They are over the borderline of our criteria for a strong relationship, which is .50.
| Coefficient Value | Strength of Association |
| 0.1 – < 0.3 | Small correlation |
| 0.3 – < 0.5 | Medium/moderate correlation |
| > 0.5 | Large/strong correlation |
We can also square our r values to interpret them in terms of variance shared or explained. Here’s how we would summarize those relationships using r2.
- Squaring the correlation of .67 indicates that employee cultural intelligence explained 45% of the variance in sustainable innovation behavior.
Putting it all together
Now it is time to summarize our results in APA format. We will start with a basic interpretation, if we were to use just a standard correlation analysis with our raw variables.
What do you need to report in your analyses?
| Value (Notation) | Assumptions |
| Correlations (r or p) | Skewness and Kurtosis |
| Degrees of Freedom (df) | Histogram/Boxplot |
| Probability (p) | Scatterplot |
| Effect Size (r2 ) |
Prior to hypothesis testing, assumptions related to outliers, normality, and linearity were checked. There were two outliers in both cultural intelligence and sustainable innovation behavior, as assessed by the inspection of a boxplot; however, all after checking normality statistics and plots, we made the decision to retain all outliers. Cultural intelligence (CQ) and sustainable innovation behavior (SIB) were normally distributed, with skewness and kurtosis values between -2 and +2. A review of scatterplots showed a linear relationship between QC and SIB.
We conducted a Pearson correlation to see if there is a relationship between cultural intelligence and sustainable innovation behavior. We found there is a significant, positive relationship between cultural intelligence and sustainable innovation behavior, (r = .67, p < .001, r2 = .45).
The r-squared value was 0.45, indicating that 45% of the variance in cultural intelligence is explained by its relationship with sustainable innovation behavior.
Real World Meaning
A correlational analysis is one that is fairly intuitive to share about the real world meaning. Most individuals understand these relational tests pretty easily. But we still want to be careful in applying our results. We know that correlation is not causation, so we want to keep that in mind as we think about the real world meaning.
In the case of this study, we would simply say that the higher an employee’s cultural intelligence is, the higher their levels of sustainable innovation behaviors are. This could be because cultural intelligence contributes to sustainable innovation behavior, or perhaps there is a third variable that explains this relationship. We cannot be completely sure, but the relationship is strong enough to suggest there is some connection between employee’s cultural intelligence and innovation behavior.
References
Gölgeci, I., Swiatowiec-Szczepanska, J., & Raczkowski, K. (2017). How does cultural intelligence influence the relationships between potential and realised absorptive capacity and innovativeness? Evidence from Poland. Technology Analysis & Strategic Management, 29(8), 857–871. https://doi.org/10.1080/09537325.2016.1245858
Hu, S., Gu, J., Liu, H. & Huang, Q. (2017). The moderating role of social media usage in the relationship among multicultural experiences, cultural intelligence, and individual creativity. Information Technology & People, 30(2), pp. 265-281. https://doi.org/10.1108/ITP-04-2016-0099
Li, J., Wu, N., & Xiong, S. (2021). Sustainable innovation in the context of organizational cultural diversity: The role of cultural intelligence and knowledge sharing. PloS One, 16(5), e0250878–e0250878. https://doi.org/10.1371/journal.pone.0250878
Pandey, A. & Charoensukmongkol, P. (2019). Contribution of cultural intelligence to adaptive selling and customer-oriented selling of salespeople at international trade shows: does cultural similarity matter? Journal of Asia Business Studies, 13(1), pp. 79-96. https://doi.org/10.1108/JABS-08-2017-0138
Authors
This guide was written and created by Asia Symone Palmer, Ruth V. Walker, Kristen J. Black, Erin N. Prince, Chloe Oberkirch, and Matt C. Cavanaugh. Please address any questions, concerns, or edits to Ruth Walker at ruth-walker@utc.edu
Acknowledgements
We would like to thank Jinlong Li, Na Wu, and Shengxu Xiong for generously publishing their data through PloS One.
Copyright
CC BY-NC-ND: This license allows reusers to copy and distribute the material in any medium or format in unadapted form only, for noncommercial purposes only, and only so long as attribution is given to the creator.